
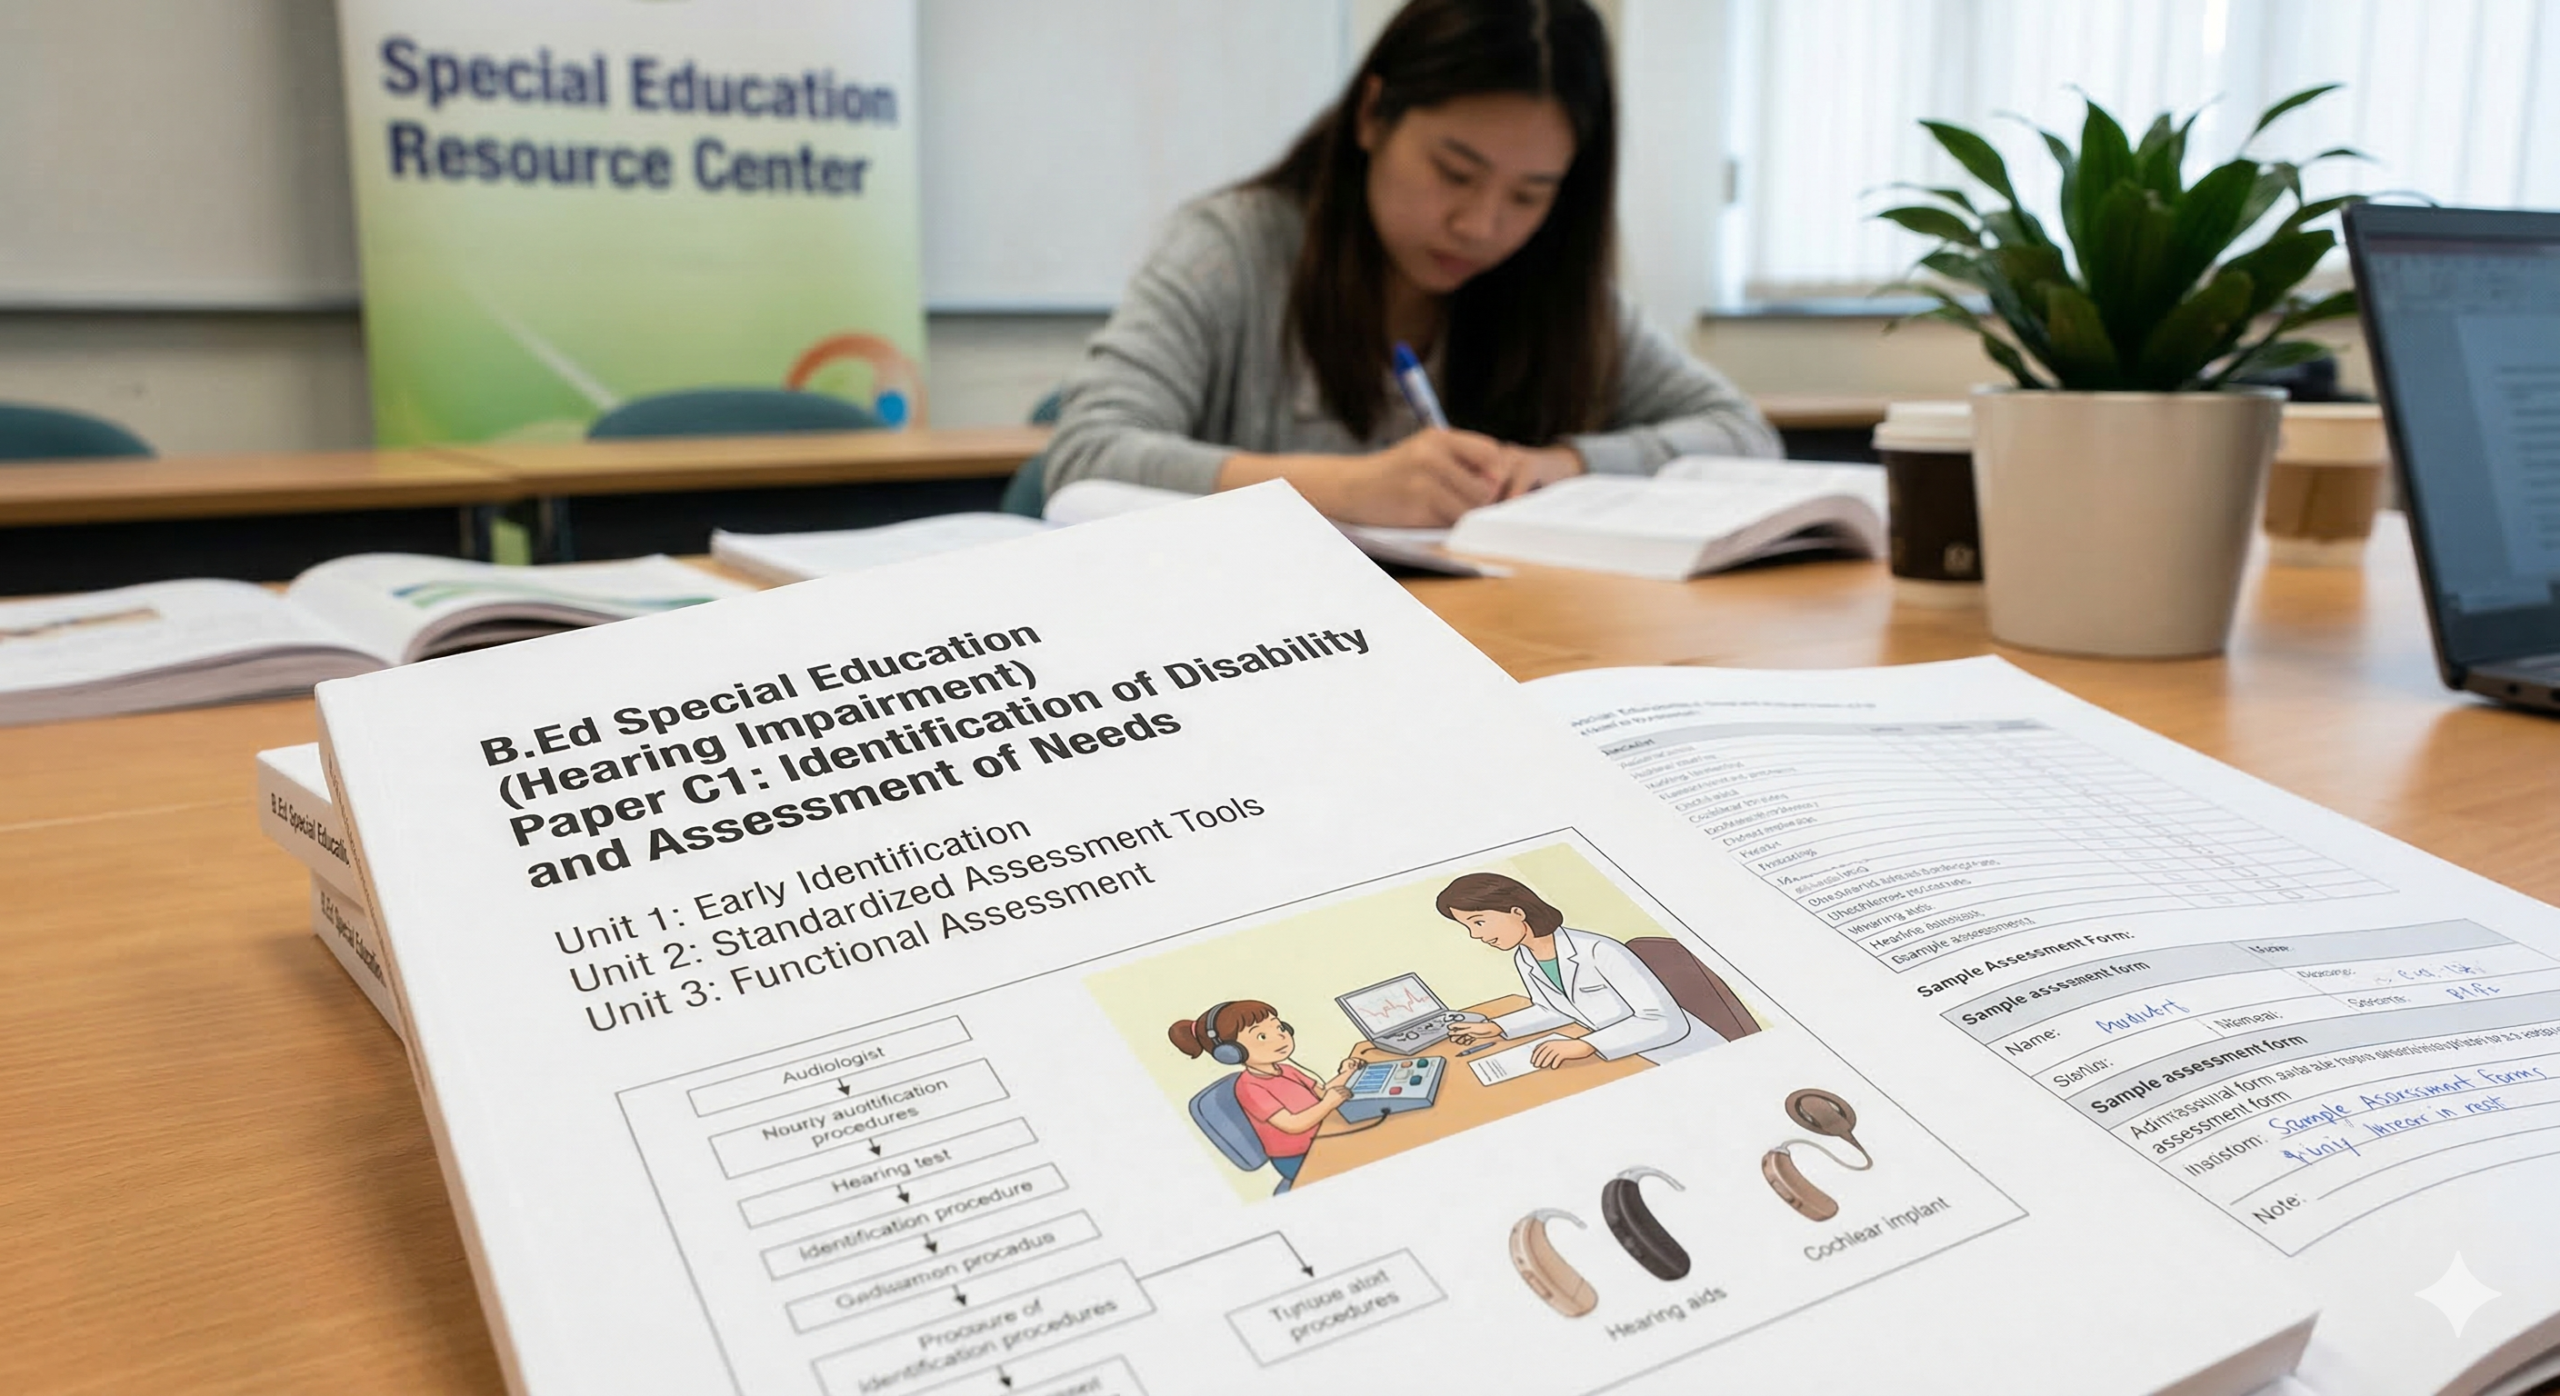
Welcome to your comprehensive study guide for the Rehabilitation Council of India (RCI) B.Ed Special Education program. If your core specialization is Hearing Impairment (HI), one of the most fundamentally important and highly technical subjects you will study is Paper C1: Identification of Disability and Assessment of Needs. Within this paper, the most critical topic is Audiology.
As a future special educator, you are not training to become a medical doctor or an audiologist. However, you absolutely must know how to read and interpret a child’s medical and audiological reports. When a deaf child is admitted to your inclusive or special classroom, the very first document the parents will place on your desk is a graph called an Audiogram. If you cannot read this graph, you cannot teach that child effectively.
In this massive, detailed 2000-word guide, we will break down the entire Paper C1 Audiological Assessment syllabus. We will explain the basics of hearing tests, how the electronic Audiometer works, the critical parameters of sound, and provide a step-by-step masterclass on how you can easily read an Audiogram. We have kept the language strictly in Simple Indian English so you can easily memorize these concepts and write them in your upcoming RCI university exams.

1. What Exactly is Audiological Assessment?
To begin your Paper C1 Audiological Assessment notes, you must define the term clearly for the examiner. Audiological assessment is the systematic, scientific, and clinical process of testing a person’s hearing ability. It is not just about finding out if a person is “deaf” or “hearing.” It is a detailed investigation that tells the medical professional and the teacher two main things:
- Degree of Hearing Loss: Exactly how much hearing has the child lost? Is the loss Mild, Moderate, Severe, or Profound?
- Type of Hearing Loss: Exactly where is the anatomical problem located inside the ear? Is the blockage in the Outer ear, the Middle ear, or is there permanent nerve damage in the Inner ear?
The Two Categories of Hearing Tests
In the field of audiology, there are two broad categories of tests used to measure hearing capacity. You must write the differences between these two in your long answers.
- Subjective Tests (Behavioral Tests): These tests require the active participation of the patient. The patient must consciously listen for a sound and then perform a physical behavior (like raising their hand, pressing a button, or dropping a toy in a bucket). Because it requires focus, it is usually done with adults and older children. The most common example is Pure Tone Audiometry (PTA).
- Objective Tests (Physiological Tests): These tests do not require the patient to do anything. In fact, the patient can be fast asleep while the test is happening! The machine calculates the hearing capacity automatically by measuring the brainwaves or the echoes inside the ear. These are absolutely crucial for testing newborn babies who cannot tell us if they hear a sound. Common examples include BERA (Brainstem Evoked Response Audiometry) and OAE (Otoacoustic Emissions).
2. The Audiometer: The Ultimate Testing Machine
An Audiometer is the primary electronic machine used by an Audiologist in a clinic to measure hearing loss. Understanding how this machine operates is a key requirement in your Paper C1 Audiological Assessment syllabus.
How the Pure Tone Audiometry (PTA) Test Works:
The testing procedure is highly controlled to ensure 100% accuracy. Here is the step-by-step process:
- The Environment: The patient is seated inside a specially designed “Soundproof Room” (or Audiometric Booth). This ensures that outside noises (like traffic or fans) do not interfere with the test results.
- The Equipment: The patient wears specialized headphones. These headphones are calibrated strictly to international medical standards. The audiologist sits outside the booth and operates the audiometer machine.
- The Process: The audiometer produces very specific “pure sounds” (like electronic beeps) at different Frequencies (Pitches) and different Intensities (Loudness).
- The Response: The audiologist plays a sound. If the patient hears it, they press a response button. The audiologist keeps making the sound softer and softer until the patient can no longer hear it.
- The Threshold: The machine records the absolute softest sound the patient can accurately hear at least 50% of the time. This softest sound level is medically defined as the patient’s “Hearing Threshold.”
3. Understanding the Science of Sound: Frequency and Intensity
Before you can even attempt to read an audiogram graph, you must deeply understand the two fundamental parameters of sound. Examiners frequently ask 5-mark short notes on these definitions in the Paper C1 Audiological Assessment exams.
Frequency (Pitch of the Sound)
Frequency refers to how high or how low a sound is. In physics, it is the number of sound wave cycles per second. It is measured in a unit called Hertz (Hz).
- Low-Frequency Sounds: These are deep, booming sounds. Examples include a drum beating, thunder, or the sound of a large truck engine. On an audiogram, these are the 125 Hz and 250 Hz marks.
- High-Frequency Sounds: These are sharp, piercing sounds. Examples include a bird chirping, a whistle, or the ringing of a telephone. On an audiogram, these are the 4000 Hz and 8000 Hz marks.
Intensity (Loudness of the Sound)
Intensity refers to the sheer volume or power of the sound wave. It is measured in a unit called Decibels (dB). To give you a real-world perspective:
- 0 to 10 dB: Extremely soft sounds, like normal quiet breathing or a leaf falling.
- 30 to 40 dB: A quiet whisper in a library.
- 50 to 60 dB: Normal, daily conversational speech between two people.
- 90 to 100 dB: Very loud noises, like a heavy traffic jam or a factory machine.
- 120 to 140 dB: The threshold of pain. Sounds this loud, like an airplane jet engine taking off nearby, will cause physical pain in the ears and immediate hearing damage.
4. What is an Audiogram? (The Master Graph)
An Audiogram is a visual graph that shows the final results of the Pure Tone Audiometry (PTA) test. It is quite literally a map of a person’s hearing threshold. Reading this graph is the most important practical skill you will learn in your Paper C1 Audiological Assessment classes.
How to Read the Grid of the Audiogram:
Imagine a standard mathematical graph with an X-axis and a Y-axis.
- The Top Horizontal Line (X-axis) shows Frequency (Pitch): It reads from left to right. It usually starts at 125 Hz (very low pitch) on the far left, moves through the middle pitches (1000 Hz, 2000 Hz), and goes up to 8000 Hz (very high pitch) on the far right. Think of it like a piano keyboard, going from low keys to high keys.
- The Side Vertical Line (Y-axis) shows Intensity (Loudness): It reads from top to bottom. This is the tricky part for students: the numbers go DOWN. It starts from -10 dB or 0 dB (very soft sounds) at the very top of the page, and goes down to 100 dB, 110 dB, and 120 dB (very loud sounds) at the bottom of the page.
Rule of Thumb: Marks at the top of the graph mean good hearing. Marks at the bottom of the graph mean terrible hearing.
The Universal Medical Symbols on the Audiogram:
To avoid confusion, audiologists across the world use universal symbols and colors to mark the hearing threshold on the graph. You must memorize these for your exams:
- Right Ear (Air Conduction): Marked with a red “O”.
- Left Ear (Air Conduction): Marked with a blue “X”.
- Right Ear (Bone Conduction): Marked with a red “<“ symbol.
- Left Ear (Bone Conduction): Marked with a blue “>” symbol.
If you look at an audiogram and see a line of blue ‘X’ marks resting at the 80 dB line, it translates to: “The child has a severe hearing loss in the left ear across all pitches.”
5. Classification of Hearing Loss (WHO Guidelines)
When you look at the child’s Audiogram, you must calculate the average of where the marks (X and O) fall on the dB scale (usually averaging the 500 Hz, 1000 Hz, and 2000 Hz marks). Then, you compare that average with the World Health Organization (WHO) classification chart. This is a mandatory table to draw in your Paper C1 Audiological Assessment exams.
| Hearing Level Average (dB) | Degree of Hearing Loss | Educational Implication for the Teacher |
|---|---|---|
| 0 to 25 dB | Normal Hearing | No special education support required. The child hears normally. |
| 26 to 40 dB | Mild Hearing Loss | The child misses soft speech or distant voices. Needs front-row seating. |
| 41 to 60 dB | Moderate Hearing Loss | The child cannot hear normal conversations without a hearing aid. Needs speech therapy. |
| 61 to 80 dB | Severe Hearing Loss | The child can only hear loud noises (dogs barking, drums). Heavy reliance on lip-reading required. |
| 81 dB and above | Profound Hearing Loss | Cannot hear spoken language at all. Relies heavily on Indian Sign Language (ISL) or Cochlear Implants. |
6. Identifying the Type of Hearing Loss on the Audiogram
As we discussed earlier, the Paper C1 Audiological Assessment syllabus requires you to know where the damage is located in the ear. By comparing the Air Conduction marks (X and O) with the Bone Conduction marks (< and >), you can find the diagnosis.
A. Conductive Hearing Loss
In this condition, the inner ear is healthy, but the sound is blocked in the outer or middle ear (usually due to wax or infection). On the audiogram, you will see the Bone Conduction marks are normal (at the top, near 0-20 dB), but the Air Conduction marks have dropped down (showing hearing loss). The gap between these two lines is called the Air-Bone Gap (ABG).
B. Sensorineural Hearing Loss (SNHL)
In this condition, the permanent damage is inside the inner ear (cochlea) or the auditory nerve. On the audiogram, both the Air Conduction marks and the Bone Conduction marks drop down together. There is no Air-Bone Gap. They overlap each other at the bottom of the graph.
C. Mixed Hearing Loss
This is a combination of both. Both Air and Bone conduction show hearing loss (both drop down below 25 dB), but there is still a significant gap between them because the middle ear is also infected.
7. Aided vs. Unaided Audiograms
When you receive a file from the clinic, you might see two different graphs. You must know the difference between them for your practical teaching.
- Unaided Audiogram: This is the pure medical hearing test done without the child wearing any hearing aid. It simply shows their natural, biological hearing loss.
- Aided Audiogram: This is the test conducted while the child is wearing their programmed Hearing Aid or Cochlear Implant. The marks on this graph are usually represented by the letter “A”.
Educational Importance: The Aided Audiogram is the most important document for a special educator. If a child has profound 90 dB hearing loss naturally, but their Aided Audiogram shows marks at 30 dB, it proves that the hearing aid is successfully amplifying sound and the child can now hear your classroom lectures. If the ‘A’ marks are still at 80 dB, the machine is not working properly, and you must send the child back to the audiologist for reprogramming.
8. The “Speech Banana” Concept
To truly master Paper C1 Audiological Assessment, you must write about the Speech Banana in your long answers. If you map all the sounds of human conversational speech (every vowel and consonant) onto the audiogram graph, they form a shape that looks exactly like a banana right in the middle of the graph (between 250 Hz to 4000 Hz, and 20 dB to 60 dB).
If a child’s hearing threshold marks fall *below* the speech banana, it means they cannot hear any human speech without a hearing aid, no matter how loud you shout.
9. Why Must a Special Educator Know All This? (Conclusion)
You might still wonder, “Why do I need to study heavy medical audiology in a B.Ed teaching course?”
The answer is simple: Without understanding the child’s exact audiological profile, you cannot plan your teaching strategies or write an Individualized Education Program (IEP). For example, if a child’s audiogram shows a specific “High-Frequency Hearing Loss,” it means they have normal hearing for low sounds but are deaf to high-pitch sounds. They will not be able to hear consonant sounds like /s/, /sh/, /f/, or /t/. If you dictate the word “Sun” in a spelling test, they will only hear the vowel and write “Un.”
If you did not know how to read the audiogram, you would scold the child for making a silly spelling mistake. But because you are a trained special educator, you look at the audiogram, realize they cannot physically hear the /s/ sound, and you adapt your teaching by emphasizing your lip movements so they can lip-read the missing letter.
Understanding Paper C1 Audiological Assessment transforms you from an ordinary teacher into a clinical specialist. You can learn more about international audiology standards from the American Speech-Language-Hearing Association (ASHA).
Frequently Asked Questions (FAQs)
Q1: What exactly do the ‘X’ and ‘O’ symbols mean on a medical Audiogram?
Ans: According to strict international medical standards, the ‘O’ symbol (usually drawn in red ink) represents the hearing threshold of the right ear, and the ‘X’ symbol (usually drawn in blue ink) represents the left ear during an air-conduction hearing test.
Q2: What is the normal hearing decibel range for a human being?
Ans: For children and adults, a hearing threshold that falls anywhere between 0 dB to 25 dB across all the tested frequencies is medically considered to be within the normal hearing range.
Q3: Can an audiogram tell a teacher if a child needs a hearing aid?
Ans: Yes, absolutely. If the audiogram graph shows a hearing threshold that is worse than 40 dB (which falls into the Moderate hearing loss category or worse), an Audiologist will almost always prescribe and fit a hearing aid for the child to survive in a school environment.
Q4: Why do newborn babies undergo BERA tests instead of PTA?
Ans: Pure Tone Audiometry (PTA) requires the patient to consciously press a button when they hear a beep. A newborn baby cannot understand instructions or press buttons. Therefore, doctors use objective tests like BERA to automatically measure the brain’s electrical response to sound while the baby is sleeping.
We hope this massive study guide has completely cleared your doubts regarding audiology and graph reading. For more study notes, previous question papers, and CTET preparation materials, keep exploring our portal. Best of luck with your RCI exams!